Understanding profit margins is crucial for any business, regardless of size or industry. This seemingly simple calculation—revenue minus costs—reveals a wealth of information about a company’s financial health and operational efficiency. From determining pricing strategies to securing funding, a firm grasp of profit margin calculations and interpretations is essential for informed decision-making.
This guide will explore the various types of profit margins (gross, operating, and net), delve into their calculation methods, and demonstrate how to interpret the results within the context of industry benchmarks. We will also examine how different business models influence profit margin calculations and explore strategies for improving profitability.
Understanding the Basic Profit Margin Formula
Profit margin is a crucial financial metric that reveals the profitability of a business. It expresses the percentage of revenue that translates into profit after deducting expenses. Understanding the different types of profit margins and how to calculate them is essential for effective business management and decision-making.
Fundamental Components of the Profit Margin Formula
The basic building blocks of any profit margin calculation are revenue, cost of goods sold (COGS), and profit. Revenue represents the total income generated from sales. Cost of goods sold (COGS) encompasses all direct costs associated with producing goods or services sold, including raw materials, direct labor, and manufacturing overhead. Gross profit is the difference between revenue and COGS, representing the profit generated before considering operating expenses.
This forms the foundation for calculating various profit margins.
Types of Profit Margins
Several types of profit margins provide different perspectives on a company’s profitability. The most common are gross profit margin, operating profit margin, and net profit margin. Each provides insights into different aspects of the business’s financial health.
Calculating Gross Profit Margin
The gross profit margin focuses solely on the profitability of the core business operations. It is calculated by dividing gross profit by revenue and multiplying by 100 to express it as a percentage.
Gross Profit Margin = (Revenue – COGS) / Revenue – 100
For example, if a company has revenue of $1,000,000 and COGS of $600,000, its gross profit margin is ($1,000,000 – $600,000) / $1,000,000100 = 40%. This indicates that 40% of the revenue remains as profit after covering the direct costs of production.
Calculating Operating Profit Margin
The operating profit margin considers operating expenses, which include administrative costs, selling expenses, and research and development costs. It shows how efficiently a company manages its operations to generate profit.
Operating Profit Margin = Operating Income / Revenue – 100
Operating income is calculated as Revenue – COGS – Operating Expenses. Let’s say the company from the previous example has operating expenses of $200,000. Its operating income would be $1,000,000 – $600,000 – $200,000 = $200,000. Therefore, its operating profit margin is $200,000 / $1,000,000 – 100 = 20%.
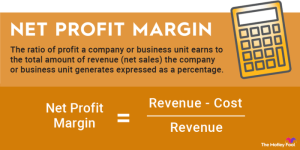
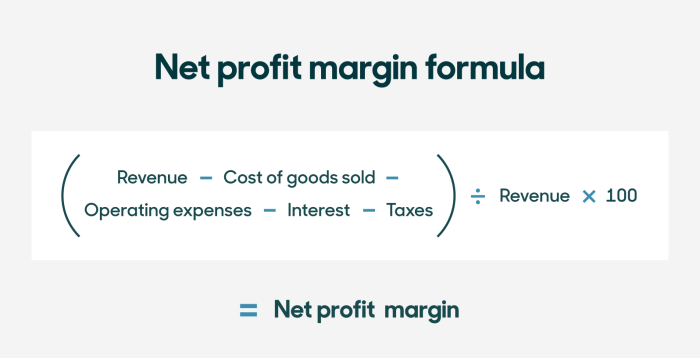
Calculating Net Profit Margin
The net profit margin is the ultimate measure of profitability, considering all expenses, including taxes and interest. It represents the percentage of revenue that translates into actual profit for the company.
Net Profit Margin = Net Income / Revenue – 100
Assuming the company from the previous examples has a net income of $150,000 after accounting for taxes and interest, its net profit margin is $150,000 / $1,000,000 – 100 = 15%.
Comparison of Profit Margin Types
The following table summarizes the key differences and uses of the three main profit margin types:
| Profit Margin Type | Formula | What it Measures | Uses |
|---|---|---|---|
| Gross Profit Margin | (Revenue – COGS) / Revenue – 100 | Profitability of core operations | Assess pricing strategies, efficiency of production |
| Operating Profit Margin | Operating Income / Revenue – 100 | Profitability after operating expenses | Evaluate operational efficiency, compare to industry benchmarks |
| Net Profit Margin | Net Income / Revenue – 100 | Overall profitability after all expenses | Assess overall financial health, track profitability trends |
Variations of the Profit Margin Formula

The basic profit margin formula provides a foundational understanding of profitability. However, its application varies depending on the specific business model and the level of detail required. Different types of profit margins offer a more nuanced perspective on a company’s financial health, considering various cost structures and revenue streams. Understanding these variations is crucial for accurate financial analysis and informed decision-making.The profit margin formula adapts to different business contexts, particularly when considering the diverse cost structures inherent in service-based versus manufacturing businesses.
Indirect costs also play a significant role in refining profit margin calculations, providing a more complete picture of profitability. Finally, the distinction between gross and net profit margins highlights the impact of different cost categories on the final profit figure.
Profit Margin Variations Across Business Models
Service-based businesses typically have lower costs of goods sold (COGS) compared to manufacturing businesses. Their primary expenses are often labor, marketing, and overhead. A service-based company might calculate its profit margin as (Revenue – Operating Expenses) / Revenue. In contrast, manufacturing companies include direct material costs, direct labor costs, and manufacturing overhead in their COGS. Their profit margin calculation would be (Revenue – COGS – Operating Expenses) / Revenue, resulting in a potentially lower profit margin due to higher COGS.
This difference highlights the importance of understanding the specific cost structure of a business when interpreting profit margin figures.
The Impact of Indirect Costs on Profit Margin Calculations
Indirect costs, such as rent, utilities, and administrative salaries, are not directly tied to the production or delivery of a specific product or service. However, they are essential for business operations. Including indirect costs in the profit margin calculation provides a more comprehensive view of profitability. Ignoring indirect costs can lead to an overestimation of profit margins, especially for businesses with high overhead.
For example, a business might calculate its gross profit margin without considering rent, only to find its net profit margin significantly lower once rent and other indirect costs are factored in. The more accurately indirect costs are allocated and included, the more reliable the profit margin calculation becomes.
Gross Profit Margin versus Net Profit Margin
Gross profit margin focuses solely on the relationship between revenue and the direct costs associated with producing goods or services (COGS). It is calculated as (Revenue – COGS) / Revenue. This metric provides insight into the profitability of a company’s core operations, before considering other expenses. Net profit margin, on the other hand, takes into account all expenses, including operating expenses, interest, taxes, and depreciation.
It is calculated as (Net Income) / Revenue. Net profit margin offers a more holistic view of profitability, representing the ultimate profit after all costs are considered. The difference between gross and net profit margin reveals the impact of operating expenses and other indirect costs on overall profitability.
Examples Illustrating Changes in COGS or Revenue
The following examples illustrate how changes in COGS or revenue affect different profit margins:
- Scenario 1: Increase in Revenue
A company with a revenue of $100,000 and COGS of $60,000 has a gross profit margin of 40% (($100,000 – $60,000) / $100,000). If revenue increases to $120,000 while COGS remains constant, the gross profit margin increases to 50% (($120,000 – $60,000) / $120,000). This demonstrates the direct relationship between revenue and gross profit margin, assuming COGS remains relatively stable. - Scenario 2: Decrease in COGS
A company with a revenue of $100,000 and COGS of $60,000 has a gross profit margin of 40%. If COGS decreases to $50,000 while revenue remains constant, the gross profit margin increases to 50% (($100,000 – $50,000) / $100,000). This illustrates how efficiency improvements leading to lower COGS can significantly boost profit margins. - Scenario 3: Combined Effect
If a company experiences both a revenue increase and a decrease in COGS, the impact on profit margin is amplified. For example, an increase in revenue from $100,000 to $120,000 and a decrease in COGS from $60,000 to $40,000 results in a gross profit margin of 66.7% (($120,000 – $40,000) / $120,000). This showcases the synergistic effect of increased sales and improved efficiency.
Interpreting Profit Margin Results
Understanding profit margins goes beyond simply calculating the percentage; it involves interpreting the results within the context of the business and its industry. A high profit margin isn’t always good, and a low profit margin isn’t always bad. The key lies in comparative analysis and understanding the underlying factors.Profit margin analysis provides valuable insights into a company’s operational efficiency, pricing strategies, and overall financial health.
By comparing a company’s profit margin to industry benchmarks and analyzing contributing factors, businesses can identify areas for improvement and make informed strategic decisions.
Profit Margin Interpretation Relative to Industry Benchmarks
A company’s profit margin should always be considered relative to its industry. A 20% profit margin might be excellent for a low-cost, high-volume business but poor for a luxury goods manufacturer. Industry benchmarks, often available through market research firms or industry associations, provide a valuable context for evaluating a company’s performance. A company consistently exceeding its industry’s average profit margin suggests strong competitive advantages, while a consistently lower margin might indicate areas needing improvement in efficiency, pricing, or cost control.
For example, a software company with a 30% profit margin might be considered strong if the industry average is 20%, while a grocery store with a 2% profit margin might be acceptable if the industry average is around 1%.
Factors Influencing Profit Margin
Several factors can significantly influence a company’s profit margin. These include:
- Cost of Goods Sold (COGS): Higher COGS directly reduce profit margins. Efficient inventory management, negotiating better supplier terms, and optimizing production processes can all help control COGS.
- Operating Expenses: These include salaries, rent, marketing, and administrative costs. Reducing unnecessary expenses or finding more efficient ways to operate can improve profit margins.
- Pricing Strategies: Pricing directly impacts revenue and, consequently, profit margin. A premium pricing strategy might yield higher profit margins but requires a strong brand and value proposition. Conversely, a low-cost strategy might result in lower margins but attract a larger customer base.
- Sales Volume: Higher sales volume can spread fixed costs over more units, increasing profit margin, even if the profit per unit remains the same.
- Economic Conditions: Recessions or economic downturns can negatively impact sales and profit margins, while periods of economic growth often have the opposite effect.
Profit Margin and Pricing Strategies
The relationship between profit margin and pricing strategies is complex and interdependent. A higher price generally leads to a higher profit margin per unit, but it might also reduce sales volume. Conversely, a lower price can increase sales volume, potentially offsetting the lower profit margin per unit. The optimal pricing strategy balances these factors to maximize overall profitability.
Consider a company choosing between a high-price, low-volume strategy targeting a niche market with high willingness to pay, versus a low-price, high-volume strategy aiming for mass market appeal. Both strategies can be successful, but their impact on profit margin will differ.
Case Study: Analyzing Profit Margins for “Coffee Corner”
Let’s analyze the profit margins of a hypothetical coffee shop, “Coffee Corner,” over three years.
| Year | Revenue | Cost of Goods Sold (COGS) | Gross Profit | Operating Expenses | Net Profit | Net Profit Margin |
|---|---|---|---|---|---|---|
| 2021 | $100,000 | $30,000 | $70,000 | $40,000 | $30,000 | 30% |
| 2022 | $120,000 | $36,000 | $84,000 | $45,000 | $39,000 | 32.5% |
| 2023 | $150,000 | $45,000 | $105,000 | $55,000 | $50,000 | 33.3% |
Note: Net Profit Margin = (Net Profit / Revenue) – 100Coffee Corner shows a steady increase in its net profit margin over the three years, indicating improved operational efficiency and/or pricing strategies. However, further analysis would be needed to determine the specific drivers of this improvement. For instance, did increased sales volume contribute more to the higher profit margin than improvements in cost control or pricing?
Mastering the profit margin formula empowers businesses to make data-driven decisions, optimize pricing strategies, and ultimately enhance profitability. By understanding the nuances of different profit margin types, interpreting results effectively, and implementing strategic improvements, companies can gain a significant competitive advantage. Remember, while profit margin is a key indicator, it’s vital to consider it alongside other financial metrics for a holistic view of business performance.
Essential Questionnaire
What is the difference between gross profit margin and net profit margin?
Gross profit margin considers only the direct costs associated with producing goods or services (COGS), while net profit margin accounts for all expenses, including indirect costs like administrative and marketing expenses.
How can I improve my profit margin if my revenue is stagnant?
Focus on reducing costs. Examine COGS, negotiate better deals with suppliers, streamline operations, and identify areas for cost-cutting without compromising quality or customer service.
What are some industry-specific factors that influence profit margins?
Factors vary widely. Competition, raw material costs, labor costs, regulatory environments, and consumer demand all significantly impact profit margins across different sectors.
Is a high profit margin always a good sign?
Not necessarily. While a high profit margin suggests strong profitability, it’s crucial to compare it to industry averages and consider other factors. An exceptionally high margin might indicate inflated pricing or a lack of competition, potentially unsustainable in the long run.