Understanding gross profit margin is crucial for any business, regardless of size or industry. This key metric reveals the profitability of your core operations, shedding light on the efficiency of your production or service delivery. A deep dive into gross profit margin unveils not only its calculation but also its implications for strategic decision-making, from pricing adjustments to cost-cutting initiatives.
This guide provides a clear and comprehensive overview, equipping you with the knowledge to effectively analyze and improve your bottom line.
We’ll explore the intricacies of calculating gross profit margin, examining its nuances across various industries and business models. Further, we’ll compare it to other profitability metrics, such as net profit margin, to provide a holistic view of financial health. Ultimately, you’ll gain the insights necessary to leverage this critical metric for sustainable business growth.
Interpreting Gross Profit Margin

Understanding gross profit margin is crucial for assessing a business’s profitability and overall financial health. It provides insights into the efficiency of operations and the pricing strategies employed. A thorough interpretation considers various internal and external factors influencing this key metric.Factors Influencing Gross Profit MarginSeveral factors significantly impact a company’s gross profit margin. These can be broadly categorized as cost-related factors and revenue-related factors.
Cost-related factors include the cost of goods sold (COGS), which encompasses direct materials, direct labor, and manufacturing overhead. Efficient inventory management, negotiating favorable terms with suppliers, and implementing cost-saving measures in production directly affect COGS and consequently the gross profit margin. Revenue-related factors include pricing strategies, sales volume, and the product or service mix. A company might choose to increase prices to improve its margin, but this can affect sales volume.
Conversely, increasing sales volume without a commensurate increase in COGS can also boost the gross profit margin. The mix of high-margin and low-margin products also plays a critical role. For example, a company selling both premium and standard products will see its overall gross profit margin affected by the proportion of each sold.
High Gross Profit Margin Indication
A high gross profit margin generally suggests strong pricing power, efficient operations, and a potentially lucrative business model. It indicates that a company is effectively managing its costs while commanding premium prices for its products or services. This allows for greater flexibility in managing operating expenses and investing in growth initiatives. Companies with consistently high gross profit margins often enjoy greater financial stability and attract more investors.
For example, a luxury goods company with a high gross profit margin can absorb increased raw material costs or fluctuations in market demand more easily than a company with a low gross profit margin.
Low Gross Profit Margin Implications
A low gross profit margin can signal several potential problems. It might indicate intense competition forcing price reductions, inefficient operations leading to high COGS, or a flawed pricing strategy. Companies with low gross profit margins often face challenges in covering operating expenses, making them more vulnerable to economic downturns or changes in market conditions. This can limit their ability to invest in research and development, marketing, or expansion.
For instance, a grocery store operating on thin margins might struggle to absorb unexpected increases in food costs, potentially leading to reduced profitability or even losses.
Gross Profit Margin Across Business Models
Gross profit margins vary significantly across different business models. Businesses with high-value, low-volume products or services, such as luxury car manufacturers or specialized consulting firms, tend to have higher gross profit margins compared to businesses with low-value, high-volume products or services, such as fast-food restaurants or discount retailers. The nature of the industry, the level of competition, and the pricing strategies employed all contribute to these differences.
For example, a software company selling a proprietary software solution might enjoy a significantly higher gross profit margin than a clothing retailer selling mass-produced garments. A comparison should always consider the specific industry context and business model involved.
Profit Margins
Profit margins are crucial indicators of a company’s financial health and profitability. They represent the percentage of revenue that translates into profit after deducting certain costs. Understanding different types of profit margins provides a more comprehensive picture of a business’s performance than relying solely on a single metric. Analyzing these margins allows for a nuanced assessment of efficiency, pricing strategies, and overall financial strength.
Types of Profit Margins
Several key profit margins offer a multifaceted view of profitability. Each margin excludes different costs, providing unique insights into various aspects of the business operation. A holistic understanding requires analyzing them together, not in isolation.
Gross Profit Margin
Gross profit margin, already discussed, focuses on the profitability of a company’s core operations before considering overhead and other expenses. It’s calculated as (Revenue – Cost of Goods Sold) / Revenue. A high gross profit margin suggests efficient production or strong pricing power.
Operating Profit Margin
Operating profit margin reveals profitability after deducting operating expenses, such as salaries, rent, and utilities, from gross profit. The formula is Operating Income / Revenue. This margin offers a clearer picture of a company’s operational efficiency and its ability to manage its day-to-day costs. For example, a company with a high gross profit margin but a low operating profit margin might be struggling with high administrative costs.
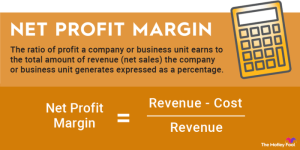
Net Profit Margin
Net profit margin represents the ultimate profitability after all expenses, including interest, taxes, and depreciation, have been deducted. It’s calculated as Net Income / Revenue. This margin provides the most comprehensive view of a company’s overall profitability, reflecting its success in managing all aspects of its business. A high net profit margin indicates strong overall financial health and efficient management of all resources.
Relationship Between Profit Margins: A Flowchart Illustration
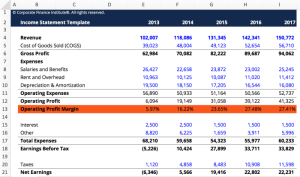
Imagine a flowchart where Revenue is the starting point. The first branch subtracts the Cost of Goods Sold (COGS) to arrive at Gross Profit. From Gross Profit, operating expenses are subtracted to yield Operating Income (or EBIT – Earnings Before Interest and Taxes). Then, interest and taxes are deducted from Operating Income to arrive at Net Income.
Each stage represents a different profit margin: Gross Profit Margin, Operating Profit Margin, and Net Profit Margin respectively. The flowchart visually demonstrates how each margin builds upon the previous one, providing a layered understanding of profitability. A company with a high revenue but low net profit margin might indicate issues with operational efficiency or excessive non-operating expenses. Conversely, a low revenue but high net profit margin could signify excellent cost control and pricing strategies.
Mastering the concept of gross profit margin empowers businesses to make informed decisions, optimize operations, and ultimately, enhance profitability. By understanding its calculation, interpretation, and the factors influencing it, businesses can strategically navigate the competitive landscape and achieve sustainable success. Regular analysis of your gross profit margin, coupled with proactive adjustments, will be key to your long-term financial health and growth.
Remember to consider the broader context of your business and industry when interpreting this crucial metric.
Frequently Asked Questions
What is the difference between cost of goods sold (COGS) and operating expenses?
COGS are directly related to producing your goods or services (raw materials, direct labor). Operating expenses are indirect costs like rent, salaries, and marketing.
Can a high gross profit margin indicate poor pricing strategy?
Yes, sometimes a high gross profit margin can signal that prices are excessively high, potentially alienating customers and impacting sales volume. It’s crucial to balance profitability with market competitiveness.
How does seasonality affect gross profit margin?
Seasonal fluctuations in demand can impact both revenue and costs, leading to variations in gross profit margin throughout the year. Businesses should account for these variations in their financial planning.
How can I improve my gross profit margin if my industry has naturally low margins?
Focus on efficiency improvements, cost reduction strategies, and exploring opportunities for economies of scale. Consider innovative pricing strategies to maximize revenue within the constraints of your industry.