Understanding profit margins is crucial for business success. This guide delves into the intricacies of calculating and interpreting various types of profit margins – gross, operating, and net – providing clear examples and comparisons. We’ll explore industry benchmarks, highlighting the factors that influence profitability across different sectors. This analysis will equip you with the knowledge to assess your own financial health and identify strategies for improvement.
Beyond simple calculations, we’ll examine how pricing strategies, cost management, sales volume, and operational efficiency all interact to shape your profit margin. We’ll also compare profit margins with other key financial metrics like ROI, ROA, and ROE, offering a holistic view of your business performance. Finally, we’ll show you how to visualize your profit margin data effectively using charts and graphs, making your financial story easier to understand and communicate.
Profit Margin vs. Other Key Financial Metrics

Profit margin, while a crucial indicator of a company’s profitability, doesn’t tell the whole story. Understanding how it relates to other key financial metrics provides a more comprehensive view of a company’s financial health and performance. This section will compare profit margin with return on investment (ROI), return on assets (ROA), and return on equity (ROE), highlighting their similarities and differences.Profit margin focuses solely on the profitability of sales, while ROI, ROA, and ROE consider the efficiency of capital utilization.
These metrics offer a broader perspective, incorporating the investment made to generate those profits. Comparing these metrics allows for a more nuanced assessment of a business’s overall performance.
Profit Margin vs. Return on Investment (ROI)
ROI measures the return generated on an investment relative to its cost. It’s calculated as (Net Profit / Investment Cost)100%. Unlike profit margin, which only considers sales revenue and costs, ROI considers the total investment, encompassing things like equipment purchases, research and development, and marketing expenses. A high ROI suggests efficient capital allocation, even if the profit margin is relatively low.
For example, a company with a low profit margin but a high ROI might be operating with a high volume of sales and efficient cost management, indicating strong operational efficiency. Conversely, a high profit margin but a low ROI might indicate poor capital allocation or high investment costs.
Profit Margin vs. Return on Assets (ROA)
ROA measures how effectively a company uses its assets to generate profit. It’s calculated as (Net Profit / Total Assets)100%. This metric provides insight into a company’s operational efficiency and how well it manages its assets. A high ROA suggests efficient asset utilization, maximizing profit generation from available resources. In contrast to profit margin, which focuses on sales, ROA considers all assets, including fixed assets like property, plant, and equipment.
A company might have a high profit margin but a low ROA if it’s heavily reliant on debt financing, tying up a significant portion of its assets in interest payments.
Profit Margin vs. Return on Equity (ROE)
ROE measures how effectively a company uses shareholder investments to generate profit. It’s calculated as (Net Profit / Shareholder Equity)100%. This metric is particularly relevant for investors as it indicates the return on their investment in the company’s stock. A high ROE signifies efficient use of shareholder capital, delivering strong returns to investors. Unlike profit margin, which ignores the source of financing, ROE focuses specifically on the return generated from equity financing.
A company could have a high profit margin but a low ROE if it’s heavily leveraged, meaning a larger portion of its financing comes from debt rather than equity.
Comparison Table
| Metric | Formula | Focus | Interpretation |
|---|---|---|---|
| Profit Margin | (Net Profit / Revenue) – 100% | Profitability of Sales | Higher is better, indicates pricing and cost efficiency. |
| Return on Investment (ROI) | (Net Profit / Investment Cost) – 100% | Return on Total Investment | Higher is better, reflects efficient capital allocation. |
| Return on Assets (ROA) | (Net Profit / Total Assets) – 100% | Efficiency of Asset Utilization | Higher is better, shows effective asset management. |
| Return on Equity (ROE) | (Net Profit / Shareholder Equity) – 100% | Return on Shareholder Investment | Higher is better, indicates strong returns for investors. |
Visualizing Profit Margins
Understanding profit margin trends and variations across different parts of a business is crucial for effective strategic decision-making. Visual representations, such as graphs and charts, are invaluable tools for quickly grasping complex financial data and identifying key areas for improvement or further investigation. The following sections detail how to effectively visualize profit margins using line graphs and bar charts.
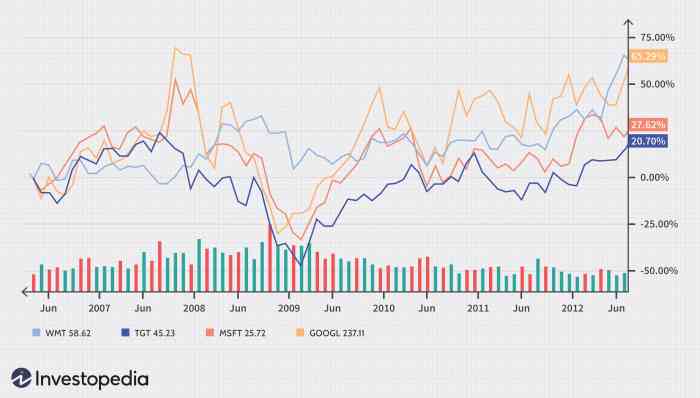
Line Graph of Profit Margin Trends Over Time
A line graph is ideal for showing the change in profit margin over a specific period. This allows for easy identification of upward or downward trends, seasonal fluctuations, and the impact of specific events or initiatives. The horizontal axis (x-axis) represents time, typically in months or years, providing a chronological view of the profit margin. The vertical axis (y-axis) represents the profit margin itself, usually expressed as a percentage.
Each data point on the graph represents the profit margin for a given time period. For example, a point might represent a profit margin of 15% in January 2023. Connecting these data points creates a line illustrating the overall trend. Analyzing the slope of the line can reveal whether profit margins are increasing, decreasing, or remaining relatively stable.
Sharp changes in the slope might indicate the impact of significant business events, such as a marketing campaign or a change in pricing strategy. A clear legend should be included to explain the data represented.
Bar Chart Comparing Profit Margins Across Different Product Lines or Business Segments
A bar chart effectively compares profit margins across various product lines or business segments. The horizontal axis (x-axis) represents the different product lines or business segments being compared. The vertical axis (y-axis) represents the profit margin, again expressed as a percentage. Each bar represents a specific product line or segment, with the height of the bar corresponding to its profit margin.
For instance, a bar might show a 20% profit margin for Product A, while another shows a 10% margin for Product B. This visual comparison allows for immediate identification of high-performing and low-performing areas of the business. Color-coding the bars can further enhance readability and comparison. A clear legend should be included to identify each product line or business segment.
This visualization aids in strategic resource allocation, highlighting areas requiring improvement or further investment.
Mastering profit margin analysis is not merely about crunching numbers; it’s about gaining a strategic advantage. By understanding the factors that influence your profit margins and employing effective strategies for improvement, you can steer your business toward sustainable growth and profitability. This guide provides the framework; your implementation will determine your success. Remember to regularly monitor and analyze your profit margin trends, adapting your strategies as needed to navigate the ever-changing business landscape.
FAQs
What is the difference between gross, operating, and net profit margin?
Gross profit margin considers only revenue and cost of goods sold. Operating profit margin includes operating expenses. Net profit margin accounts for all expenses, including taxes and interest.
How frequently should I analyze my profit margins?
Ideally, monthly or quarterly analysis allows for timely adjustments to your business strategy. The frequency depends on your business’s size and complexity.
Can a low profit margin still indicate a healthy business?
Yes, in some industries, particularly those with high volume and low-cost products, a lower profit margin can be acceptable if sales volume compensates.
What are some common pitfalls to avoid when analyzing profit margins?
Avoid comparing your margins to companies in vastly different industries or those with significantly different business models. Also, ensure consistent accounting practices over time for accurate trend analysis.